
CURRENT AFFAIRS – 14/05/2024
- CURRENT AFFAIRS – 14/05/2024
- Food inflation surges to four-month high in April
- UN-linked body defers accreditation of NHRC-India for second year in a row
- India, Iran sign 10-year contract for Chabahar port operation
- Declining poverty ratio: a continuing trend
- The impact of 50 years of vaccination on children worldwide
- An overview of the Smart Cities Mission
- At 1.74 billion, China remained top import partner for India in FY2024
- Stabilising India-Nepal ties in Changing Times
- North America : Resources [Mapping]
CURRENT AFFAIRS – 14/05/2024
Food inflation surges to four-month high in April
(General Studies- Paper III)
Source : The Hindu
About:
- Inflation (or less frequently, price inflation) is a general rise in the price level of an economy over a period of time. When the general price level rises, each unit of currency buys fewer goods and services; consequently, inflation reflects a reduction in the purchasing power per unit of money – a loss of real value in the medium of exchange and unit of account within the economy.
- As per RBI, an inflation target of 4 per cent with a +/-2 per cent tolerance band, is appropriate for the next five years (2021-2025).
Type of Inflation
- Demand-Pull Inflation: Demand Pull inflation occurs when the demand for goods and services exceeds their supply. When the overall demand in the economy is high, consumers are willing to pay more for the available goods and services, leading to a general rise in prices.
- A booming economy with high consumer spending can create excess demand, putting upward pressure on prices.
- Cost-Push Inflation: Cost-push inflation is driven by an increase in the production costs for goods and services. This can be caused by factors such as increased incomes, increased costs of raw materials, or disruptions in the supply chain.
- For instance, (as per CPI data) inflation in ‘oils and fats’ in March, 2022 soared to 18.79% as the geopolitical crisis due to the Russia-Ukraine war pushed edible oil prices higher.
Measurement of Inflation
- Wholesale Price Index (WPI) – It is estimated by the Ministry of Commerce & Industry and measured on a monthly basis.
- Consumer Price Index (CPI) – It is calculated by taking price changes for each item in the predetermined lot of goods and averaging them.
- Producer Price Index – It is a measure of the average change in the selling prices over time received by domestic producers for their output.
- Commodity Price Indices – It is a fixed-weight index or (weighted) average of selected commodity prices, which may be based on spot or futures price
- Core Price Index – It measures the prices paid by consumers for goods and services without the volatility caused by movements in food and energy prices. It is a way to measure the underlying inflation trends.
- GDP deflator – It is a measure of general price inflation.
Important Terms related to Inflation
- Disinflation: Reduction in the rate of inflation
- Deflation: Persistent decrease in the price level (negative inflation)
- Reflation: Price level increases when the economy recovers from recession based on value of inflation
- Creeping inflation – If the rate of inflation is low (upto 3%)
- Walking/Trotting inflation – Rate of inflation is moderate (3-7%)
- Running/Galloping inflation – Rate of inflation is high (>10%)
- Runaway/Hyper Inflation – Rate of inflation is extreme
- Stagflation: Inflation + Recession (Unemployment)
- Misery index: Rate of inflation + Rate of unemployment
- Inflationary gap: Aggregate demand > Aggregate supply (at full employment level)
- Deflationary gap: Aggregate supply > Aggregate demand (at full employment level)
- Suppressed / Repressed inflation: Aggregate demand > Aggregate supply. Here govt will not allow rising of prices.
- Open inflation: A situation where price level rises without any price control measures by the government.
- Core inflation: Based on those items whose prices are non-volatile.
- Headline inflation: All commodities are covered in this.
- Structural inflation: Due to structural problems like infrastructural bottlenecks.
UN-linked body defers accreditation of NHRC-India for second year in a row
(General Studies- Paper II)
Source : The Hindu
What is GANHRI?
- GANHRI is recognised and a trusted partner, of the United Nations.
- It was established in 1993 as the International Coordinating Committee of National Institutions for the promotion and protection of human rights (ICC).
- It has been known as the Global Alliance of National Human Rights Institutions (GANHRI) since 2016 and is a member-based network organization that gathers NHRIs from all around the world.
- It is composed of 120 members, India also is a member of GANHRI
- Its secretariat is situated in Geneva, Switzerland.
NHRC
- About:
- NHRC of India is an independent statutory body established on 12th October, 1993 as per provisions of Protection of Human Rights Act, 1993, later amended in 2006.
- It is the watchdog of human rights in India, i.e. the rights related to life, liberty, equality and dignity of the individual guaranteed by Indian Constitution or embodied in the international covenants and enforceable by courts in India.
- It was established in conformity with the Paris Principles, adopted for the promotion and protection of human rights in Paris (October, 1991) and endorsed by the on 20 December, 1993.
- Composition:
- Key Members: It is a multi-member body consisting of a chairperson, five full-time Members and seven deemed Members.
- A person who has been the Chief Justice of India or a judge of the Supreme Court can become a chairman.
- Appointment: The chairperson and members are appointed by the President on the recommendations of a six-member committee consisting of the Prime Minister as its head, the Speaker of the Lok Sabha, the Deputy Chairman of the Rajya Sabha, leaders of the Opposition in both the Houses of Parliament and the Union Home Minister.
- Tenure: The chairperson and members hold office for a term of three years or until they attain the age of 70 years, whichever is earlier.
- The President can remove the chairman or any member from the office under some circumstances.
- Removal: They can be removed only on the charges of proved misbehavior or incapacity, if proved by an inquiry conducted by a Supreme Court Judge.
- Divisions: Commission also has five Specialized Divisions i.e. Law Division, Investigation Division, Policy Research & Programmes Division, Training Division and Administration Division.
- Key Members: It is a multi-member body consisting of a chairperson, five full-time Members and seven deemed Members.
India, Iran sign 10-year contract for Chabahar port operation
(General Studies- Paper II)
Source : The Hindu
- India and Iran signed a 10-year agreement for the operation of the Chabahar port, marking a significant milestone in their cooperation.
Back2Basics: Chabahar Port
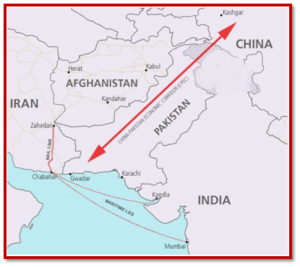
- The port is located in southeastern Iran in the Sistan-Baluchistan province, on the Gulf of Oman and at the mouth of the Strait of Hormuz.
- It is called the “Golden Gate” to Central Asian land-locked countries of Afghanistan, Turkmenistan and Uzbekistan.
- It serves as Iran’s only oceanic port and consists of two separate ports named Shahid Kalantari and Shahid Beheshti.
- It is only about 170 km west of the Gwadar port if Pakistan.
- The development of Chabahar port was initiated by India with a MoU in 2015 and executed in 2016 during PM Narendra Modi’s visit to Iran.
About the Agreement
- The contract, signed between Indian Ports Global Ltd. (IPGL) and Port and Maritime Organisation (PMO) of Iran, involves substantial investment and development initiatives.
- IPGL will invest approximately $120 million in equipping the Shahid-Behesti terminal, enhancing the port’s efficiency and capacity.
- India has extended a credit window of $250 million for mutually identified projects aimed at improving Chabahar-related infrastructure, emphasizing its commitment to regional development.
Strategic Importance of Chabahar Port to India
- Chabahar port will boost India’s access to Iran, the key gateway to the International North-South Transport Corridor that has sea, rail and road routes between India, Russia, Iran, Europe and Central Asia.
- Chabahar port will be beneficial to India in countering Chinese presence in the Arabian Sea which China is trying to ensure by helping Pakistan develop the Gwadar port.
- India can bypass Pakistan in transporting goods to Afghanistan.
Economic Significance
- Chabahar Port is at an important point on the Arabian Sea, with easy access from India’s west coast.
- Kandla port in Gujarat is the closest port at 550 nautical miles, while the distance between Chabahar and Mumbai is 786 nautical miles.
- Since 2019, the port has handled more than 80,000 twenty-foot equivalent units (TEUs) of container traffic and more than 8 million tonnes of bulk and general cargo.
- The port also offers an alternative route from the Strait of Hormuz for cargo traffic between Central Asian countries and Afghanistan.
Declining poverty ratio: a continuing trend
(General Studies- Paper II)
Source : The Hindu
- Introduction:
- The release of the Household Consumption Expenditure Survey (HCES) for 2022-23 by the National Sample Survey Office (NSSO) prompted discussions among researchers on poverty and inequality trends.
- Studies analysed poverty ratios and inequality estimates based on the data, addressing comparability issues and measurement complexities.
- Trends in Poverty and Inequality:
- Poverty estimates based on the HCES fact sheet indicate a significant decline from 29.5% in 2011-12 to 10% in 2022-23, according to the Rangarajan and Tendulkar Committee’s poverty lines.
- Inequality, measured by the Gini coefficient, decreased marginally between 2011-12 and 2022-23, particularly in urban areas.
- Poverty measurement in India:
- Tendulkar Committee’s Poverty Line: The Tendulkar Committee, formed in 2005, introduced a new methodology to estimate poverty in India. It recommended poverty lines of ₹33 per capita per day in urban areas and ₹27 per capita per day in rural areas for 2011-12, based on the consumption expenditure needed to meet minimum calorie requirements.
- Rangarajan Committee’s Poverty Line: The Rangarajan Committee, appointed by the Government of India in 2012, revised the poverty line methodology. It recommended a monthly per capita consumption expenditure of ₹972 for urban areas and ₹781 for rural areas as the poverty line for 2011-12, using a uniform consumption basket for both.
- Gini Coefficient: The Gini coefficient is a measure of income or wealth inequality within a population, with values ranging from 0 (perfect equality) to 1 (perfect inequality). It quantifies the extent to which the distribution of income or wealth among individuals or households deviates from a perfectly equal distribution.
- Issues with Data Collection and Analysis:
- Absence of unit-level data in the HCES fact sheet led to provisional estimates, although poverty numbers based on averages from deciles may still provide meaningful insights.
- Changes in the reference or recall period of data collection over time aimed at improving consumption reporting but pose challenges in comparability.
- Methodological changes in data collection, such as coverage of more items and multiple visits, enhance estimation accuracy but hinder comparability over time.
- Measurement Challenges:
- The Tendulkar Committee emphasised the inadequacy of a calorie norm-based poverty line, leading to discussions on defining new consumption baskets.
- The poverty line, based on private consumption expenditure, does not fully capture public expenditure benefits, highlighting the need for better assessment methods.
- Imputed values for public expenditure items in the HCES 2022-23 data showed only a slight increase in average monthly per capita expenditure, indicating the limitations of current measurement approaches.
- Conclusion:
- Despite the decline in poverty and inequality, challenges persist in accurately measuring and comparing trends over time.
- The complex interplay of methodological changes, data collection variations, and measurement issues underscores the need for robust evaluation frameworks.
- Addressing these challenges is crucial for informed policy-making and effective poverty alleviation strategies in India.
- Issues with poverty estimation in India:
- Poverty Line Methodology: Controversies surrounding the determination of the poverty line, including debates over consumption patterns, calorie intake, and price indices.
- Data Accuracy: Reliance on outdated or incomplete data sources, leading to inaccuracies in estimating poverty levels.
- Regional Disparities: Failure to account for regional variations in living costs, income levels, and socio-economic factors, resulting in disparities in poverty estimates.
- Multidimensional Poverty: Limited focus on multidimensional aspects of poverty, such as education, health, and access to basic services, leading to incomplete assessments.
- Urban Poverty: Challenges in capturing the complexity of urban poverty dynamics, including informal employment, housing insecurity, and social exclusion.
- Way Forward for Poverty Estimation in India:
- Revised Methodology: Adoption of more robust and transparent methodologies for poverty estimation, incorporating multidimensional indicators and regional nuances.
- Data Improvement: Enhancing data collection methods, quality, and coverage through regular surveys, data integration, and technology-driven approaches.
- Stakeholder Consultation: Engaging stakeholders, including experts, policymakers, and civil society, in the process of defining poverty measures and thresholds.
- Dynamic Monitoring: Implementing real-time monitoring systems to track changes in poverty levels and respond effectively with targeted interventions.
- Inclusive Policies: Designing and implementing poverty alleviation programs that address multidimensional aspects of poverty and target vulnerable populations effectively.
- International Best Practices: Learning from and adapting international best practices in poverty estimation and measurement to improve accuracy and relevance in the Indian context.
The impact of 50 years of vaccination on children worldwide
(General Studies- Paper II)
Source : The Hindu
- On the occasion of World Immunisation Week, April 24-30, the Indian Academy of Paediatrics has launched a campaign to focus on routine immunisation as the birthright of a child.
About Measles Vaccination
- This vaccine protects against three diseases: measles, mumps, and rubella. CDC recommends children get two doses of MMR vaccine, starting with the first dose at 12 through 15 months of age, and the second dose at 4 through 6 years of age.
- Teens and adults should also be up to date on their MMR vaccination.
Global Immunisation Efforts and Current Observations:
- World Immunisation Week Campaign by IAP
- Campaign Launch: The Indian Academy of Paediatrics (IAP) launched a campaign during World Immunisation Week (April 24-30) focusing on routine immunisation as a fundamental right of every child.
- Call for Additional Vaccines: IAP urged the government to expedite the introduction of the HPV vaccine and typhoid conjugate vaccine to address significant public health burdens.
- Current Vaccination Statistics in India
- DTP Vaccine: 93% of surviving infants received the third dose of the DTP vaccine.
- Measles Vaccine: 90% of infants received the second dose of the measles vaccine.
- Challenges: Issues include inequitable distribution of vaccines, inability to reach 90% coverage, human resource gaps, and financing problems.
- Global Impact of Immunisation
- Lives Saved: Immunisation efforts have saved an estimated 154 million lives globally over the past 50 years, equating to six lives every minute of every year.
- Infant Mortality Reduction: 101 million of the lives saved were infants. Vaccination against 14 diseases has reduced infant deaths by 40% globally and by over 50% in Africa.
- Diseases Targeted: Vaccines have contributed to reducing deaths from diseases like diphtheria, Haemophilus influenzae type B, hepatitis B, Japanese encephalitis, measles, meningitis A, pertussis, invasive pneumococcal disease, polio, rotavirus, rubella, tetanus, tuberculosis, and yellow fever.
- Specific Disease Focus
- Measles Vaccine Impact: The measles vaccine has been the most significant in reducing infant mortality, accounting for 60% of lives saved through immunisation since 1974.
- Missed Doses: In 2022, 33 million children missed a measles vaccine dose, with 22 million missing the first dose and 11 million missing the second dose.
- Coverage Rates and Goals
- Required Coverage: A 95% or greater coverage with two doses of the measles vaccine is needed to prevent outbreaks.
- Current Coverage: Global coverage rates for the measles vaccine are 83% for the first dose and 74% for the second dose, leading to numerous outbreaks.
Conclusion
- Immunisation saves lives, reduces infant mortality, and prevents outbreaks by protecting against infectious diseases, ensuring healthier communities and securing a better future for children worldwide.
An overview of the Smart Cities Mission
(General Studies- Paper II)
Source : The Hindu
How are smart cities defined by the government?
- The term ‘Smart City’ has been used widely ever since 2009, after the great financial crash.
- Smart cities were defined by urban practitioners as new Silicon Valleys built with a strong integration of a network of airports, highways, and other types of communications, a so-called intellectual city with advanced ICT.
- Hundred cities were selected for five years under the mission. However, the mission did not clearly define a smart city.
- It stated, “there is no universally accepted definition of a Smart City…. The conceptualisation of Smart City…varies from city to city and country to country, depending on the level of development, willingness to change and reform, resources and aspirations of the city residents.
Mission strategy
The Smart Cities Mission (SCM) comprises two primary components:
- Area-Based Development:
- This aspect focuses on three components:
- Redevelopment (city renewal): Revitalizing existing urban areas to improve infrastructure, amenities, and quality of life.
- Retrofitting (city improvement): Upgrading infrastructure and services in already developed areas to meet contemporary urban needs and standards.
- Greenfield projects (city extension): Developing new urban areas or expanding existing cities with sustainable and modern infrastructure.
- Pan-City Solutions based on ICT:
- This facet involves implementing integrated solutions across various sectors using Information and Communication Technology (ICT). These solutions typically fall under six categories:
- E-governance: Utilizing digital platforms for efficient and transparent governance processes.
- Waste management: Implementing systems for effective waste collection, segregation, and disposal.
- Water management: Enhancing water supply infrastructure and promoting conservation measures.
- Energy management: Implementing energy-efficient technologies and promoting renewable energy sources.
- Urban mobility: Improving transportation systems to enhance connectivity and reduce congestion.
- Skill development: Promoting programs to enhance the skills and employability of the urban workforce.
The core infrastructure elements
- Adequate water supply,
- Assured electricity supply,
- Sanitation, including solid waste management,
- Efficient urban mobility and public transport,
- Affordable housing, especially for the poor,
- Robust IT connectivity and digitalization,
- Good governance, especially e-Governance and citizen participation,
- Sustainable environment,
- Safety and security of citizens, particularly women, children and the elderly, and
- Health and education.
The Financing
- The Smart City Mission operated as a Centrally Sponsored Scheme (CSS) and the Central Government proposes to give financial support to the Mission to the extent of Rs. 48,000 crores over five years i.e. on an average Rs 100 crore per city per year.
- An equal amount, on a matching basis, will have to be contributed by the State/ULB; therefore, nearly Rupees one lakh crore of Government/ULB funds will be available for Smart Cities development.
Concerns/Challenges
- The selection of 100 cities on a competitive basis was flawed due to the diversity in existing urban realities. The scheme was divorced from the ground realities of urban India — the urbanisation here is dynamic and not static like the West.
- The SCM became an exclusionary scheme wherein not more than 1% of a city’s geographical area was selected for development. State and local governments lack fine-grained data or the capability to analyse them in order to understand the evolving needs of their communities.
- Additionally, the SPV model designed for smart cities was not aligned with the 74th Constitutional Amendment, which led to many cities objecting to the governance structure.
- In the name of executing smart city projects, there was displacement of people living in poorer localities.
- Street vendors, for example, were displaced and urban commons were disrupted.
- Another major consequence of the SCM has been enhanced urban flooding. Some of the towns which have historically never been flooded were made vulnerable because of infrastructure development projects that spoiled or dismantled the water channels and contours.
Way forward:
- Contextual Planning: Develop flexible and adaptive plans that consider the unique and dynamic nature of Indian urbanization, rather than applying a one-size-fits-all model.
- Community Involvement: Engage local communities in the planning process to ensure that projects reflect the needs and realities of different urban areas.
At 1.74 billion, China remained top import partner for India in FY2024
(General Studies- Paper III)
Source : The Hindu
China retained its spot as top import partner for India in 2023-24 with goods inflows increasing 3.29% (year-on-year) to $101.74 billion as opposed to an overall 5.66% decline in the country’s imports, as per government figures.
High-tech items such as telecom and smartphone parts, laptop and PCs, as well as industrial inputs such as plastic, iron and steel and chemicals contributed substantially to the imports.
“The figures across essential and strategic sectors like electronics, pharmaceuticals, and renewable energy highlight the depth of India’s import dependence on China. This situation underscores potential risks of supply-chain disruptions and the need for strategic reassessment to diversify sources and enhance domestic production capabilities,” as per Global Trade Research Initiative (GTRI).
Russia at No.2
Russia vaulted to the second spot among India’s top import sources, surpassing UAE and the U.S. in 2023-24. Imports from Russia rose 34% to $61.44 billion during the fiscal, comprising mostly oil.
Stabilising India-Nepal ties in Changing Times
(General Studies- Paper II)
Source : The Hindu
Context:
- The article delves into Nepal’s current political and economic turbulence, reflecting on its transition to democracy and the resurgence of pro-China sentiments.
- It highlights India’s strategic concerns amidst these changes, emphasising the need for nuanced diplomacy and developmental engagement to navigate the complexities of the India-Nepal relationship and uphold regional stability.
Introduction:
- There is growing restlessness and uncertainty in Nepal due to political and economic challenges, prompting discussions about the country’s governance and future trajectory.
- Recent political developments, including shifts in alliances and foreign policy decisions, have heightened concerns about Nepal’s stability and its relations with neighboring countries.
- While the transition to a full-fledged democracy underpinned by credible political institutions seems to be an unending one, there is also confusion about the direction in which it is headed.
Uncertainties in Nepal
- Questions on Governance: Nepal faces questions about the effectiveness of its transition to a secular federal democratic republic, with debates surrounding the rushed adoption of its Constitution and the loss of its Hindu identity.
- Foreign Policy Dynamics: Recent political shifts, including changes in coalition partners and diplomatic overtures to China, have raised concerns about Nepal’s alignment and its implications for regional dynamics, particularly its relationship with India.
- Challenges for Stability: Political instability, governance issues, and concerns about corruption pose significant challenges for Nepal’s stability and development, necessitating careful attention from both domestic and international stakeholders.
Changes under China’s shadow
- Pro-China and anti-India: One reason for attention is the recent dramatic change in the coalition partners of the incumbent Prime Minister, Maoist leader Pushpa Kamal Dahal ‘Prachanda’, which saw the largest party in Parliament, the centrist Nepali Congress (NC), being replaced by the second largest party led by K.P. Sharma Oli, who when Prime Minister in the past, had gained the reputation of being pro-China and anti-India.
- The Chinese were the first to officially welcome the renewed alliance between the two major left parties, which they have been urging for long, sometimes publicly, and clumsily.
- This time around they managed to avoid public controversy and allow the revival of the partnership to look as if it was a purely internal matter.
- There have also been high-level military visits where new understandings have reportedly been reached.
- China’s intentions are very clear: to expand its influence in Nepal at the cost of India’s. Interestingly, the revival of the far left is being accompanied by a strong clamour from forces on the far right, which include calls for the restoration of the institution of monarchy and Nepal’s Hindu identity.
- Nepal, which was once the world’s only Hindu kingdom, was converted by its Parliament into a secular federal republic shortly after the Maoist insurgency ended and the Maoists agreed to be mainstreamed into the country’s democratic polity a few years ago.
- Both sets of forces have the reputation of being ultra-nationalistic, pro-China and anti-India. Even otherwise, continuing political instability and malgovernance could invite a proliferation of India-directed mischief from Nepal by third countries and their non-official partners — the ‘nexus’ of smuggling and terrorism in Pakistan that India’s External Affairs Minister S. Jaishankar recently described as an ‘industry’.
- During the last phase of the King Birendra years, political instability accompanied by frequent changes of government (a result of political opportunism), facilitated the spread of a Maoist insurgency within Nepal which later established its headquarters in a jungle hideout in India. In parallel, there was an escalation of the smuggling of drugs, arms and terrorist-related cross-border activities masterminded from Pakistan against India, from Nepalese soil. The latter culminated in the hijacking of flight IC 814 in December 1999.
- The redeeming feature then was a stable relationship between India and Nepal under Nepal’s ‘twin pillar’ policy of supporting the king and multi-party democracy, which resulted in India’s discreet cooperation and good relations across the political spectrum. It also saw Indian and Nepalese intelligence agencies working to expose Pakistani involvement.
- Eventually, the situation quickly developed into a multi-faceted crisis, causing upheavals and transformations in Nepal and new questions about the quality of its bilateral ties with India.
- Unlike in the past, China is now proactively working against India in Nepal. No longer does it have a low profile. It would probably be openly supportive of any cross-border instigation of terrorist activities in India — which, for China, would come under the category of “good terrorism”.
- It suits Pakistan to do its bit too as it knows that it can rely on China for support when needed. Theoretically, India is not alone. It has the Quad (Australia, India, Japan, the United States), Indo-Pacific and other groupings keeping a close watch on China’s moves to expand its influence through fair means and foul. However, it would be risky to assume that these would be of help if a Great Game 2.0 begins in a shaky Nepal.
India’s Role and Strategic Considerations:
- India maintains a cautious approach, avoiding interference in Nepal’s internal affairs despite pressure and temptations to intervene.
- Anticipating calls for a return to Hindu identity or the restoration of monarchy, India faces challenges in providing careful responses without causing confusion.
- Proposing a holistic development roadmap for Nepal could offer an alternative to Chinese influence, focusing on sustainable development and cross-party consensus.
- High-level Indian attention and investment could foster optimism, stability, and mutually beneficial projects while addressing Nepal’s developmental needs.
- Diplomatic style and substance play crucial roles in shaping India-Nepal relations, with India bearing responsibility in overcoming historical power dynamics.
- With regard to Nepal, the many concerns complicating the India-Nepal relationship need not be an insoluble migraine. The new government in New Delhi in June this year has its work cut out.
North America : Resources [Mapping]
- North America produces most of the world’s corn, meat, cotton, soybeans, tobacco, and wheat, along with a variety of other food and industrial raw material crops.
- Mineral resources are also abundant; the large variety includes coal, iron ore, bauxite, copper, natural gas, petroleum, mercury, nickel, potash, and silver.

Agriculture
- From the freezing Arctic to the tropical jungles of Central America, North America enjoys more climate variation than any other continent. Almost every type of ecosystem is represented somewhere on the continent, from coral reefs in the Caribbean to the ice sheet in Greenland. These differences contribute to North America’s variety of agricultural industries, which are often divided by climate zone:
- tropical zone,
- subtropical zone,
- cool temperate zone,
- dry zone
- Tropical Zone –
- Farmer’s harvest oranges, sugar cane, coffee, cocoa, and bananas. These crops grow on coastal plains and humid mountain slopes. Cotton and hemp are cultivated in the warmer and drier intermediate climate zone. These crops are important exports for Central American countries.
- Sub – tropical Zone –
- Fruits, vegetables, cotton, and tobacco are predominant in the warm, subtropical zones of northern Mexico and the United States.
- Important agricultural areas in this zone include the Rio Grande Valley (citrus fruits) in the U.S. state of Texas and Mexico, California’s Central Valley (fruits and vegetables), the Gulf Coastal Plain (vegetables), and the sandy valleys of the Appalachians (cotton and tobacco).
- These areas benefit from ample rain and warm air currents.
- Cool Temperate Zone –
- Important agricultural areas in this climate include the Finger Lakes region of New York in the U.S.; the Niagara Peninsula in the Canadian province of Ontario; the Columbia River basin in the U.S. state of Washington and the Canadian province of British Columbia; and the valleys of the Appalachians.
- These areas benefit from excellent drainage and predictable, established frosts.
- The Dairy Belt, Corn Belt, and Wheat Belt are three agricultural areas in the continent’s cool temperate zones.
- Dairy animals, including cows, goats, and sheep, feed on the hay and hardy small grains that thrive in New England and the Great Lakes-St. Lawrence region along the Atlantic coast. This is the Dairy Belt.
- The Corn Belt, located between the Ohio River and the lower Missouri River, receives ample water and strong summer sun, ideal for corn and soybeans.
- West of the Corn Belt, the Wheat Belt stretches from the U.S. state of Kansas through the Canadian Prairie Provinces of Alberta, Saskatchewan, and Manitoba. This vast area of the Great Plains allows wheat to be cultivated in both winter and spring.
- Dry Zone –
- Dry zones, common in the southwestern U.S. and northern Mexico, are ideally suited for livestock ranching.
- Ranches with thousands of cattle are common in this region. Traditionally, livestock fed on locally grown fodder such as prairie grasses. However, irrigation for fruit and cotton farming has drained water supplies in the region.
- Native grasses cannot nourish the huge herds of livestock kept by ranchers. Cattle, sheep, hogs, and other livestock are less likely to graze than to eat corn-based feed.
- In fact, most of the corn grown in the Corn Belt is feeder corn used for livestock feed.
Forestry
- Forestry is the management, cultivation, and harvesting of trees and other vegetation in forests. In the Pacific Northwest, for instance, logging companies harvest cedar, fir, and spruce trees.
- Lumber from these trees is exported around the world for construction. Some of the continent’s largest paper mills are found in these temperate rain forests. In addition to paper, paper mills produce cardboard and fiberboard.
- Forestry is a major economic activity for much of North America. In the United States, the timber industry is strong in the Pacific Northwest, the Gulf states, and South Atlantic coastal plains. In Canada, forestry is a major industry in the provinces of Quebec, Ontario, and British Columbia.
Mining
- North America is a leading producer of coal, used in energy production; bauxite used to create aluminum; iron and copper, both used in construction; and nickel, used to create steel, which North American companies export around the world. Gold and silver mines operate in the western part of the continent. Visitors to Crater of Diamonds State Park, a mine in the U.S. state of Arkansas, can search for their own diamonds.
- Coal–
- Coal remains a primary industry for the U.S. and is often linked with states near the Appalachians.
- Coal can be mined underground or in large, open pits. Around 20% of the World’s Coal is mined in Pennsylvania, USA.
- Metallic minerals–
- Large deposits of iron ore are found in the areas around Lake Superior and the Eastern part of the Canadian shield. Iron is also found in the southern Appalachians.
- The USA is one of the largest producers of copper in the world. It is mined extensively around the great lakes and the Rocky Mountains.
- Mexico is the world’s largest producer of silver. Large deposits of silver are found in the USA and Canada too. It is a byproduct of the Zinc industry as well. Chihuahua is the largest silver mine in the World. It is in Mexico.
- Canada and the US produce a substantial amount of Gold which is mined in the Rocky Mountains. California and Alaska saw the Gold rush in the early 1900s.
- Canada produces about 90% of the world’s Nickle.
- Canada is also the largest producer of Asbestos, Zinc, and platinum and the second-largest producer of cobalt, Uranium, and radium. Note that China is also one of the World’s largest producer of Asbestos.
- The USA is one of the world’s largest producer of Uranium and Sulphur.
Drilling
- North America is home to vast deposits of oil and natural gas, which are drilled for energy and fuel. Oil and gas extraction are key elements of North America’s economy. The United States, Canada, and Mexico are among the world’s top oil producers.
- The Athabasca tar sands, in the Canadian province of Alberta, are the world’s largest reservoir of heavy crude oil. More than 20 national and international extraction projects are established in the Athabasca tar sands.
- Large reserves of Petroleum are found in North America in a great arc from Alaska to Texas in the USA. The United States is the top oil-producing country in the world, with an average of 17.87 million b/d, which accounts for 18% of the world’s production.
- The U.S. overtook Russia in 2012 for the No. 2 spots and surpassed former leader Saudi Arabia in 2013 to become the world’s top oil producer. Much of the increased U.S. production is attributable to fracking in the shale formations in Texas and North Dakota. The U.S. has been a net exporter of oil (i.e., exports exceed imports) since early 2011.
- Mexico leads other North American countries as one of the top oil exporters in the world, largely because of its reserves in and around the Gulf. (Although both the United States and Canada produce more oil than Mexico, they also consume far more. Both countries are mostly importers, not exporters, of oil and natural gas.)