CURRENT AFFAIRS – 04/04/2024
CURRENT AFFAIRS – 04/04/2024
SC to list before polls pleas to verify count in all EVMs
(General Studies- Paper II)
Source : The Hindu
The Supreme Court, on April 3, has agreed to list a series of petitions concerning the verification of Voter Verifiable Paper Audit Trail (VVPAT) slips with Electronic Voting Machines (EVMs) ahead of the Lok Sabha polls.
Key Highlights
- Petition Details:
- The petitions advocate for a comprehensive count of VVPAT slips in elections, challenging the current practice of verifying only five randomly selected EVMs through VVPAT paper slips.
- They referenced a previous Supreme Court judgment in 2013, Subramanian Swamy v. Election Commission of India, emphasizing the importance of transparency and restoring voter confidence in the electoral process.
- The court had held the necessity of a “paper trail” to ensure free and fair elections, directing the Election Commission of India (ECI) to integrate VVPAT with EVMs.
- It is highlighted that while the government had spent nearly ₹5,000 crore to purchase nearly 24 lakh VVPATs, only slips from approximately 20,000 VVPATs could be verified.
- Election Commission’s Affidavit and Response:
- In a 450-page affidavit, the Election Commission counters these concerns, asserting that there is no fundamental right of the voter to verify their votes through VVPATs.
- The EC reassures the Supreme Court that EVMs are secure and cannot be hacked or tampered with, emphasizing their stand-alone nature with one-time programmable chips.
- Explanation of Existing VVPAT System:
- The EC defends the existing VVPAT system, stating that it allows electors to verify whether their votes have been accurately recorded.
- They mention the provision for mandatory verification of printed VVPAT part slips from five randomly selected polling stations of each Assembly constituency/segment as an audit of electronic votes before the results.
- Challenges in 100% VVPAT Verification:
- The Election Commission cites practical challenges in implementing 100% VVPAT verification, noting that chemically-coated slips are sticky and time-consuming to count.
- They estimate it would take an hour to count slips from just one VVPAT machine, highlighting the logistical difficulties in comprehensive verification.
- Notably, 102 Parliamentary constituencies across 21 States and Union Territories are scheduled for polls in the first phase on April 19.
About the Voter Verifiable Paper Audit Trail (VVPAT)
- The Voter Verifiable Paper Audit Trail (VVPAT) is a method used during elections to provide a paper trail for votes cast electronically.
- It is employed in conjunction with Electronic Voting Machines (EVMs) to enhance the transparency and credibility of the electoral process.
- VVPAT allows voters to verify that their vote has been accurately recorded by the EVM by providing them with a physical paper receipt of their vote.
- The VVPAT system consists of two parts:
- the VVPAT Printer and the VVPAT Status Display Unit (VSDU).
- Voter Verification:
- When a voter casts their vote using an EVM, a paper slip containing the details of the candidate and the symbol chosen by the voter is printed out by the VVPAT printer attached to the EVM.
- This paper slip is displayed behind a transparent window for a few seconds (typically around 7 seconds) for the voter to verify.
- Verification by Voter:
- The voter is expected to visually inspect the printed paper slip to ensure that the details match their chosen candidate.
- If the printed details are accurate, the voter can be assured that their vote has been correctly registered by the EVM.
- Paper Trail:
- Once the verification process is complete, the paper slip is automatically cut and dropped into a sealed container attached to the EVM, creating a physical record of the vote.
- These paper slips serve as a paper trail that can be used for audit and verification purposes in case of disputes or recount requests.
- Counting and Verification:
- After the voting process is concluded, the paper slips stored in the sealed containers are used for cross-verification during the counting process.
- Election officials can manually tally the paper trail with the electronic vote count recorded by the EVMs to ensure the accuracy of the results.
Restrictions imposed on pilgrims visiting Ahobilam temple
(General Studies- Paper I)
Source : The Hindu
The Forest Department and Sri Lakshmi NarasimhaSwamyDevasthanam (SLNSD) at Ahobilam have implemented restrictions on visitors to the shrine, comprising nine temples within the Nallamala forest.
- These measures are due to concerns regarding the intense heatwave affecting the movement of wild animals in the area.
Key Highlights
- Protected Tiger Reserve:
- The Nagarjunasagar-Srisailam Tiger Reserve (NSTR), established in 1983, spans approximately 3,727.82 sq km, covering core and buffer areas.
- The Ahobilam region falls within the jurisdiction of the Ahobilam National Tiger Conservation Authority (NTCA), overseeing the preservation of rare flora and fauna, including red sanders, leopards, deer, and five resident tigers.
- Reasons for Restrictions:
- The restrictions aim to safeguard wildlife amidst the heatwave.
- All forms of plastic have been banned to prevent environmental pollution, with visitors required to deposit such items at the Cheethal base camp.
- Overnight stays are prohibited to mitigate potential conflicts between humans and nocturnal animals.
- Prohibitions and Guidelines:
- In addition to the ban on plastic, activities such as cooking, carrying, and consuming liquor and cigarettes are prohibited within the forest.
- Visitors are urged to adhere to specified entry hours to minimize disturbances to wildlife.
About the Nallamala forest

- The Nallamala Forest is a large forest located in the Indian states of Andhra Pradesh and Telangana, and it is part of the Eastern Ghats mountain range.
- The forest is spread over five districts, namely Nandyal, Prakasam, Guntur, Nalgonda, and Kadapa District Mahabub Nagar in Telangana State.
- It is known for its lush forest cover and is home to a rich variety of flora and fauna.
- The Nallamala Forest is the largest forest in South India, apart from the Western Ghats, and is located south of the Krishna River.
- The Nallamala Hills, where the forest is located, run in a nearly north-south alignment, parallel to the Coromandel Coast for close to 430 km between the rivers, Krishna and Pennar.
- The hills have an average elevation of about 520 m, with Bhairani Konda at 1100 m and GundlaBrahmeswara at 1048 m being the tallest peaks.
- The forest is known for its rugged, sparsely populated hills, which are composed mostly of jumbled quartzites and slates, and exemplify the mountain scenery of the Eastern Ghats.
- The Nallamala Forest is home to a wide variety of wildlife, including tigers, leopards, black buck, wild hog, peacock, pangolin, Indian Python, and King Cobras, as well as several rare bird species.
- The forest is part of the Nagarjunsagar-Srisailam Tiger Reserve, which is the largest tiger reserve in India and has a sizable tiger population.
- The tiger reserve is spread over five districts of Kurnool, Prakasam, Guntur, Nalgonda, and Mahabub Nagar across the two states of Telangana and Andhra Pradesh.
- The total area of the tiger reserve is 3,728 km2, with a core area of 1,200 km2.
- The Nallamala Forest is also home to the Chenchu tribe, who have built their lives, cultural practices, spiritual beliefs, and livelihoods around the forest.
- The forest is considered a source of livelihood for the Chenchu, and they have a strong affiliation with it, despite being displaced from it.
- The creation of the Nagarjunsagar-Srisailam Tiger Reserve in 1978 led to the displacement of the Chenchu tribe, but some of them are now employed by the conservation authorities as anti-poaching squads, ecotourism guides, forest guards, and tiger trackers.

Turning the spotlight on the urban poor
(General Studies- Paper II)
Source : The Hindu
The India Employment Report (IER) 2024, published by the Institute for Human Development and the International Labour Organization, raises questions regarding the trickle-down effect of economic growth on the working class.
- It highlights a 5.4% average real economic growth from 2015-16 to 2022-23 and discusses divergent trends in rural and urban employment and income.
Key Highlights
- Urban-Rural Disparities in Employment and Income:
- The IER reveals significant disparities between rural and urban areas in terms of employment and income.
- Despite a relatively higher unemployment rate in urban areas (4.8% in 2000 compared to 1.5% in rural areas), average monthly earnings are substantially higher for various employment categories in urban settings.
- The coexistence of higher unemployment rates and wages in urban areas poses questions about its implications for the urban poor.
- This phenomenon requires further investigation to understand its effects on economic mobility and decent work opportunities for urban residents, particularly those in poverty-stricken areas like slums.
- Trends in Rural-Urban Migration:
- Historically, higher income prospects and a better quality of life in urban areas have driven rural-urban migration.
- However, the IER indicates a decline in male migration for economic purposes, suggesting a shift in migration trends.
- Rural poor households increasingly migrate to slums rather than formal settlements, indicating the need for an analysis of income and employment patterns among slum dwellers.
- Such analysis would shed light on the potential for economic mobility and decent work opportunities for the urban poor in India.
- Introduction to Survey in Kolkata Slums:
- A survey across 37 slums in various parts of Kolkata was conducted in 2012.
- Subsequently, these slums were revisited for another survey in 2022-23.
- However, only 29 slums could be tracked, as some had undergone redevelopment or eviction processes.
- The survey covered 513 slum households in 2012 and 396 in 2021-22.
- Data from 2019, the pre-COVID-19 year, was collected to understand overall trends from 2012, avoiding the COVID-19-affected years of 2019-22 for comparison purposes.
- Consistency in Major Occupations:
- The survey reveals that major occupations in Kolkata’s slums remained largely consistent over the decade, with approximately one-fourth of the working population engaged in unskilled labor, which emerged as the most stable and significant occupation in these areas.
- This trend mirrors the findings of the India Employment Report (IER) 2024, which indicates that a quarter of workers in India were involved in unskilled labor during the same period.
- Shifts in Employment Patterns:
- While unskilled labor remained prevalent, there were notable shifts in other occupations.
- Employment in skilled and semi-skilled labor decreased by 6%, and in private organizations by 3% between 2012 and 2019.
- However, there was a 9% increase in employment in petty businesses or small shops, indicating a rise in entrepreneurial endeavors within slum communities.
- Surprisingly, the share of other self-employed individuals declined by 3%.
- Emergence of New Occupations:
- The survey also highlights the emergence of new occupations over the past decade.
- Employment in truck driving and cleaning increased by 5%, while construction and related work witnessed a 4% rise.
- Notably, employment in construction and related work was minimal in 2012 but gained momentum over the years.
- Income Trends in Kolkata Slums:
- In 2012, the average monthly income in Kolkata’s slums was approximately ₹4,900.
- However, this income decreased by 5% at constant prices (2012) by 2019.
- Variation in Income Across Occupations:
- Income levels varied significantly across different occupations within the slums.
- Government employees consistently had the highest income in both 2012 and 2019, although their real income decreased by 5% in 2019.
- Conversely, domestic servants and unskilled workers consistently had the lowest income.
- Decline in Real Income:
- The data highlights a notable decline in real income for various occupations between 2012 and 2019.
- Construction and related work experienced the highest decline of 51%, followed by petty business or small shop owners and government employees, both witnessing a 32% decrease.
- Need for Gainful Employment Options:
- The decline in income and the increase in engagement with petty businesses or small shops and construction-related work underscore the need for more gainful employment opportunities.
- Medium to large shop owners also experienced a significant decrease in real income by 26%.
- Popularity of Labor Work and Changes in Skilled Employment:
- The popularity of labor work increased, possibly due to the rise in real income for unskilled labor by 33%.
- However, there was a reduction in the availability of skilled or semi-skilled labor work, despite a 12% increase in income for this category.
- Comparison with IER 2024 Findings:
- The India Employment Report (IER) 2024 illustrates similar trends in changes in employment and wages.
- The share of self-employed individuals increased between 2000 and 2019, with a decline in real monthly wages for self-employed and regular workers but an increase for casual workers.
- Income Dynamics in Slums:
- A notable trend observed is the decrease in income among the highest earners, such as government servants, alongside a doubling of real income for the lowest earners like domestic servants.
- This indicates a general decline in income levels across slum dwellers, accompanied by a reduction in income disparities from 2012 to 2019.
- Gender Composition in the Workforce:
- While the percentage of women in the workforce in Kolkata’s slums decreased by 3% between 2012 and 2021-22, the India Employment Report (IER) 2024 shows a 1.6% increase in women’s workforce participation during the same period.
- This suggests a shift in female workforce participation towards non-slum areas rather than within slum communities.
- Rise in Casual Work and Its Implications:
- The rise in casual work, particularly labor-intensive roles, has been driven by increasing wages.
- However, such work often lacks proper work conditions and social security.
- Meanwhile, self-employment opportunities, such as small businesses, are increasing without a proportional rise in income.
- This indicates a growing population of low-earning petty business owners within slums.
- Impact on Urban Poor and Migration Patterns:
- The reduction in income inequality coupled with a general decline in income levels has led to deeper poverty among the urban poor.
- Despite higher incomes in urban areas compared to rural regions, this does not necessarily translate to improved economic mobility or quality of work for the urban poor.
- This phenomenon may also contribute to the declining trend in male migration observed during 2000-08.
- Need for Public Support:
- Given the challenges faced by slum dwellers, including declining incomes and limited economic opportunities, there is a pressing need for increased public support in urban areas.
- Access to affordable food and gainful employment are crucial for improving the livelihoods of urban poor communities.
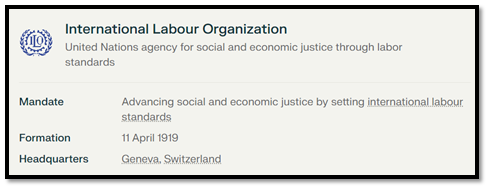
About International Labour Organization

- The International Labour Organization (ILO) is a specialized agency of the United Nations system devoted to promoting social justice and decent work worldwide.
- Established in 1919, it was the first and oldest UN agency, and it has its headquarters in Geneva, Switzerland.
- Mission and Objectives:
- The primary mission of the ILO is to promote social justice and uphold internationally recognized labor rights.
- It seeks to achieve this by setting labor standards, promoting decent work opportunities, enhancing social protection, and strengthening social dialogue among governments, employers, and workers.
- Tripartite Structure:
- One of the unique features of the ILO is its tripartite structure, which brings together representatives of governments, employers, and workers from member states.
Living wills implementation lags in India
(General Studies- Paper II)
Source : The Hindu
Living wills, legal since 2018 following a Supreme Court judgment, provide terminally-ill patients with the option to withhold or withdraw treatment and pass away with dignity.
- However, implementation remains challenging across most of India.
Key Highlights
- Complexity of Court’s Procedure:
- Initially, the Court’s procedure was deemed overly complex, aiming to prevent abuse by unscrupulous individuals seeking to inherit the patient’s property.
- The requirement for judicial magistrate countersignatures was particularly burdensome, resulting in minimal execution of living wills in the first five years post-judgment.
- Streamlined Procedure:
- Recognizing the flaws, the Court streamlined the procedure in January 2023.
- Under this revised process, living wills must be signed in the presence of two witnesses, attested by a notary or gazetted officer, and handed over to a designated “competent officer” in the local government, acting as a custodian.
- If the patient loses decision-making capacity, the treating doctor can authenticate the living will against the custodian’s copy or digital health records.
- Challenges in Implementation:
- Despite the revised procedure, local governments have generally not designated custodians for living wills, nor have protocols been established for authentication through digital health records.
- In Maharashtra, for instance, a public interest litigation was required to prompt the appointment of 417 custodians across the state.
- Need for Government Intervention:
- Effective implementation of living wills requires proactive measures from state governments and relevant authorities.
- Clear guidelines and protocols are essential to ensure that terminally-ill patients can exercise their right to make choices about their medical care and end-of-life decisions.
- Certification Process:
- Living wills do not guarantee implementation; decisions on withholding or withdrawing treatment must be certified by primary and secondary medical boards.
- The secondary board requires a doctor nominated by the chief medical officer, posing practical challenges for hospitals without such boards.
- Complexity and Ambiguity:
- The subject of death, mortality, and end-of-life care is uncomfortable for officials and individuals alike.
- The guidelines can be ambiguous, and the stakes are high.
- For instance, obtaining written consent from the ‘next of kin’ for treatment withdrawal in the absence of a living will raises legal complexities due to the lack of a clear definition for ‘next of kin’ in Indian law.
- Disagreements Among Family Members:
- When family members disagree on treatment decisions, the absence of clear legal directives exacerbates the situation.
- Without a defined legal framework, determining whose decision governs becomes contentious, leading to potential disputes among family members.
- Reluctance of Officials:
- Officials may be hesitant to implement Supreme Court judgments on such sensitive matters without explicit directives from superiors and detailed processes established by state governments.
- They prefer clear instructions to exercise discretion, seeking stability and certainty in navigating complex legal and ethical issues.
- Need for Clear Legal Framework:
- There is a pressing need for a clear legal framework to guide decision-making regarding end-of-life care and treatment withdrawal.
- Clarity in definitions, procedures, and responsibilities is essential to facilitate the implementation of living wills and ensure that terminally-ill patients’ wishes are respected.
- State Governments’ Reluctance:
- State governments exhibit reluctance in addressing the complexities of implementing living wills, given the involvement of medical and legal intricacies.
- For instance, while Haryana issued directions to civil surgeons to comply with the Supreme Court judgment, essential guidance and protocols on implementation were lacking.
- Thorough Approach in Odisha:
- In contrast, Odisha demonstrates a more comprehensive approach by forming a committee of experts to draft detailed orders for implementing the judgment.
- This proactive step indicates a commitment to navigating the complexities of end-of-life care decisions.
- Need for Central Government Intervention:
- To address the gap in expertise and facilitate effective implementation nationwide, the Central government can play a pivotal role.
- Developing and publishing model orders and protocols can provide state governments with the necessary confidence and guidance to implement the judgment effectively.
- Failure of Governments to Act:
- Despite the Supreme Court’s declaration of the right to die with dignity six years ago, governments have failed to take essential steps towards its implementation.
- This failure leaves doctors apprehensive about honoring patients’ express wishes due to concerns about legal implications.
- Call for Effective Guidance:
- Effective guidance and persistent action from all levels of government are essential to empower doctors to act in the best interests of patients.
- Only through concerted efforts can the right to die with dignity be upheld and implemented in practice.
Should State Governments borrow more?
(General Studies- Paper II)
Source : The Hindu
The financial relationship between the Union and State governments has sparked a heated debate, with the Government of Kerala seeking Supreme Court intervention regarding the permissible borrowing limit to bridge expenditure shortfalls.
- The Union government advocates for restricting borrowing to 3% of the State’s income or Gross State Domestic Product (GSDP), while Kerala argues that such restrictions undermine its financial autonomy and violate federal principles.
Key Highlights
- Disproportionate Spending Responsibilities:
- Despite the Union government’s control over tax collection, State governments shoulder a larger portion of overall government spending, particularly in sectors directly impacting citizens’ daily lives.
- Notably, social services expenditure in 2022-23 totaled ₹19,182 billion by all State governments, dwarfing the Union government’s ₹2,230 billion expenditure in the same sector.
- State Government Expenditure Dominance:
- State governments exhibit substantial dominance in expenditure across key sectors.
- In social services, education, and health, State government spending surpasses that of the Union by significant margins: 8.6 times, 2.6 times, and 3.8 times, respectively.

- Guided Spending Priorities:
- Spending priorities for both Union and State governments are guided by constitutionally allocated powers and functions.
- While the Union government allocates considerable resources to defense, transport, urban development, and energy, State governments prioritize social services and developmental expenditures.
- Trends in Developmental Expenditures:
- Developmental expenditures, particularly on social services, have witnessed a notable upsurge by State governments over the past two decades.
- As a proportion of the country’s Gross Domestic Product (GDP), combined developmental expenditures by all State governments increased from 8.8% in 2004-05 to 12.5% in 2021-22.
- Kerala’s Spending Patterns:
- Kerala’s government expenditure on education, health, and other social sectors has consistently ranged between 40% and 50% of total budgeted expenditures since the 1960s.
- This focus has propelled Kerala ahead in social sector spending compared to other states, albeit experiencing stagnation since the mid-2000s.
- A significant portion of Kerala’s budget, approximately 6% in 2022-23, is devolved to Local Self-Governments (LSGs).
- Considering LSG spending on social sectors, Kerala’s overall proportion may still surpass the average of all Indian states.
- Allocation for Salaries and Daily Expenses:
- A substantial portion of government expenditure on social services in Kerala is allocated to the revenue account, covering salaries and day-to-day expenses.
- Teachers, nurses, and other government employees, half of whom are women, have played a crucial role in driving Kerala’s social achievements.
- Pensions for retired government employees and disadvantaged sections constitute 16.4% of all budgeted expenditures by the Kerala government, significantly higher than the national average.
- Concerns Over Capital Expenditure:
- Despite the emphasis on social sector spending, only 10.6% of Kerala’s budgetary resources were directed towards capital expenditure in 2022-23.
- This raises concerns as capital expenditure is crucial for building new infrastructure and institutions to drive future growth.
- Financial Challenges and Borrowing:
- State governments like Kerala derive funds from own revenues (tax and non-tax), transfers from the Union government, and market borrowings.
- Dependency on Borrowing:
- In 2023-24, Kerala faced challenges in meeting its budget expenditure, leading to increased borrowing to 3.4% of GSDP, surpassing the borrowing limit set by the Centre.
- This highlights the financial strain faced by Kerala in balancing expenditure needs with borrowing restrictions.
- Guided Spending Priorities:

- Advocating Increased Government Spending:
- Kerala’s robust social sector can be leveraged to drive advancements in domestic income creation, necessitating an increase in government spending rather than a reduction.
- Focus on Higher Education and Research:
- Investment in higher education and research is crucial to foster an environment conducive to a knowledge-driven economy.
- Such investments are essential for long-term economic growth and innovation.
- Utilizing Domestic Savings:
- A significant portion of government borrowing in Kerala, as in other parts of India, is sourced from domestic financial institutions like public sector banks and insurance companies.
- Leveraging Kerala’s substantial private savings can also contribute to productive investment.
- Given the existing state of federal fiscal relations, any increase in government spending can only occur through greater market borrowings.
- Addressing Concerns about Debt-Financed Expenditures:
- Concerns regarding debt-financed government expenditures may be overstated.
- Economists in the Keynesian tradition argue that government borrowing can stimulate economic growth and job creation if deployed effectively to generate new incomes.
- Collective Action to Tackle Development Challenges:
- The shared challenges faced by Kerala, such as an ageing population and youth outmigration, require collaborative efforts between the Union and State governments to address.
- Pooling resources and expertise can help mitigate these challenges effectively.
- Strategic Borrowing as Part of Economic Revitalization:
- Kerala must demonstrate that its borrowing initiatives are part of a broader strategy to rebuild the economy, rather than merely addressing immediate financing needs.
- This approach can help build confidence in borrowing activities as a means of economic revitalization.
Understanding borrowing limit of states
- The borrowing limit of states in India is determined by the central government, in accordance with the recommendations of the Finance Commission and the guidelines set by the Ministry of Finance.
- The borrowing limit of states is often linked to their fiscal performance and debt sustainability, as assessed by the Finance Commission.
- The Fiscal Responsibility and Budget Management Act sets targets for fiscal indicators, including the fiscal deficit, revenue deficit, and public debt, and mandates certain fiscal rules to be followed by state governments.
- The borrowing limit of states is often linked to compliance with these fiscal targets and rules.
- Currently, borrowing limit of states is capped at 3% of Gross State Domestic Product (GSDP).
- The central government may also allow states to borrow additional amounts over and above their net borrowing limits, based on specific criteria and reform-oriented initiatives.
- For example, states were allowed to raise an extra borrowing ceiling equivalent to employer and employee share of contribution of its employees to the NPS over and above the normal net borrowing ceiling of 3% of GSDP for FY24.
- This was done to encourage states to remain in the NPS and to meet their NPS commitments in the current fiscal.
About John Maynard Keynes
- The Keynesian tradition in economics refers to the economic theories and policy prescriptions developed by the British economist John Maynard Keynes, particularly during the Great Depression of the 1930s.
- Key aspects of the Keynesian tradition in economics include:
- Aggregate Demand and Effective Demand:
- Keynes argued that fluctuations in aggregate demand, rather than supply-side factors alone, were the primary drivers of economic fluctuations, including recessions and depressions.
- He introduced the concept of “effective demand,” which refers to the total demand for goods and services in an economy that is sufficient to ensure full employment.
- Role of Government Intervention:
- Keynes challenged the classical economic view that markets would naturally self-correct and restore full employment equilibrium.
- Instead, he advocated for active government intervention to stabilize the economy during periods of recession or depression.
- Keynes proposed that the government could use fiscal policy (taxation and government spending) and monetary policy (interest rates and money supply) to influence aggregate demand and stabilize the economy.
- Countercyclical Policy:
- Keynesian economics advocates countercyclical policy measures to smooth out economic fluctuations.
- During times of recession or high unemployment, the government should increase spending, reduce taxes, and lower interest rates to boost aggregate demand and stimulate economic activity.
- Conversely, during periods of inflation or economic overheating, the government should decrease spending, raise taxes, and tighten monetary policy to cool down the economy and prevent excessive inflation.
- Multiplier Effect:
- Keynes introduced the concept of the multiplier effect, which suggests that an initial increase in spending (such as government investment) leads to a larger increase in overall economic output.
- This occurs as the initial spending generates additional rounds of spending and income through the economy, creating a multiplier effect that magnifies the impact of the initial stimulus.
- Role of Unemployment:
- Keynesian economics emphasizes the problem of involuntary unemployment and the need for government intervention to address it.
- Keynes argued that wages and prices are not always flexible enough to ensure full employment, particularly during periods of economic downturns.
- Therefore, he advocated for government policies to create job opportunities and reduce unemployment through fiscal stimulus and public works programs.
- Aggregate Demand and Effective Demand:
Nuclear power is key to development, says study
(General Studies- Paper III)
Source : The Hindu
A study conducted by academics at the Indian Institute of Management, Ahmedabad, highlights the necessity for significant investments in nuclear energy and related infrastructure for India to achieve its development goals and net zero carbon dioxide emissions by 2047 and 2070 respectively.
- The study, funded by the Office of the Principal Scientific Adviser and the Nuclear Power Corporation of India, emphasizes the current low contribution of nuclear energy, comprising only 1.6% of India’s energy mix.
Key Highlights
- Scenarios Postulated:
- The study postulates various scenarios, including high, medium, and low economic growth scenarios, along with different emphases on energy sources.
- These scenarios range from prioritizing nuclear energy to expanding fossil fuel use with carbon capture and storage, emphasizing renewable energy sources like solar and wind, or a combination of these approaches.
- Methodology and Analysis:
- Using mathematical models, the study estimate the required proportions of various energy sources by 2030 and 2050 to achieve net zero emissions by 2070.
- Factors such as India’s population achieving a human development index comparable to Western European countries and the affordability of energy access is also considered.
- Key Findings:
- In the most favorable scenario, emissions in 2070 would reduce to 0.55 billion tonnes of carbon dioxide, signifying a ‘net zero’ scenario.
- This scenario entails a five-fold increase in nuclear power capacity, reaching 30 GW by 2030 and 265 GW by 2050.
- By 2030, nuclear power would contribute 4% to India’s total energy, rising significantly to 30% by 2050.
- Interestingly, in this scenario, the share of solar power decreases from 42% in 2030 to 30% in 2050.
- Current Energy Landscape:
- Solar energy presently constitutes 16% of India’s installed generation capacity, while coal holds the majority share at 49%.
- Achieving the proposed figures for nuclear energy would necessitate a doubling of investments.
- However, a critical factor in this endeavor is the availability of uranium, a key fuel for nuclear power generation, which is restricted due to international embargoes.
- Challenges and Remarks:
- It is highlighted that there is no singular solution to achieving net zero emissions.
- The need for a diverse range of technologies to coexist within India’s energy mix is paramount.
- Coal’s Role and Transition:
- Coal is likely to remain a foundational component of India’s energy system.
- However, if India aims to phase down coal usage within the next three decades, it must develop adequate infrastructure for alternative sources like nuclear power.
- Additionally, flexible grid infrastructure and storage solutions will be essential to support the integration of renewable energy sources.
- Financial Implications:
- The transition towards a more sustainable energy landscape would require substantial financial investment.
- The report estimates that India would need approximately ₹150-200 lakh crore between 2020-2070 to finance these transitions effectively.